![]()
![]()
ggcharts provides a high-level ggplot2
interface for creating common charts. Its aim is both simple and
ambitious: shorten the distance from data visualization idea to actual
plot. How so? By taking care of a lot of data preprocessing, obscure
ggplot2 details and plot styling for you. The resulting
plots are ggplot objects and can be further customized
using any ggplot2 function.
The package is available from CRAN.
install.packages("ggcharts")Alternatively, you can install the latest development version from GitHub.
if (!"remotes" %in% installed.packages()) {
  install.packages("remotes")
}
remotes::install_github("thomas-neitmann/ggcharts", upgrade = "never")Thanks to ggplot2 you can create beautiful plots in
R. However, it can often take quite a bit of effort to get
from a data visualization idea to an actual plot. As an example, let’s
say you want to create a faceted bar chart displaying the top 10 within
each facet ordered from highest to lowest. What sounds simple is
actually pretty hard to achieve. Have a look:
library(dplyr)
library(ggplot2)
library(ggcharts)
data("biomedicalrevenue")

biomedicalrevenue %>%
  group_by(year) %>%
  top_n(10, revenue) %>%
  ungroup() %>%
  mutate(company = tidytext::reorder_within(company, revenue, year)) %>%
  ggplot(aes(company, revenue)) +
  geom_col() +
  coord_flip() +
  tidytext::scale_x_reordered() +
  facet_wrap(vars(year), scales = "free_y")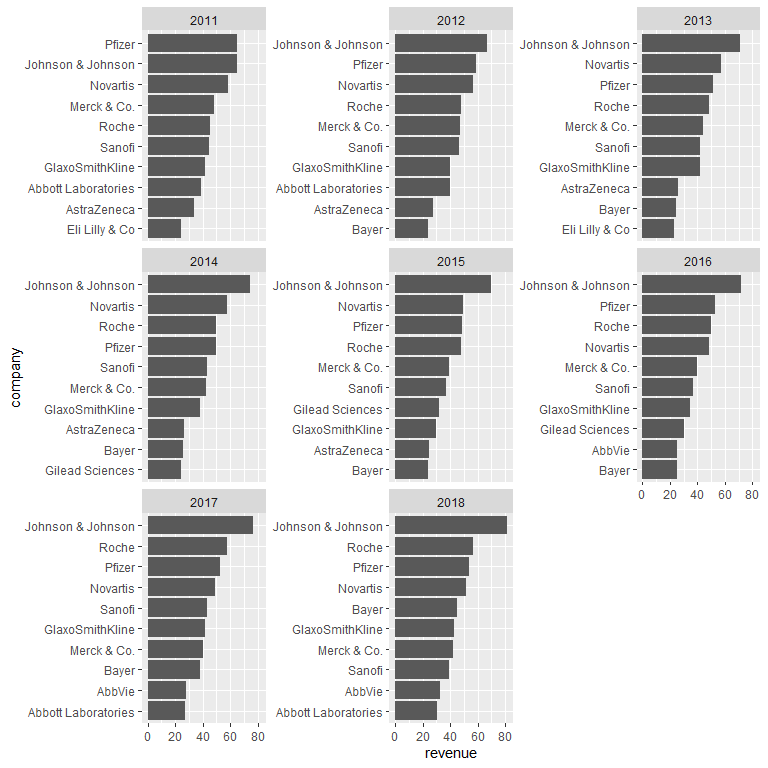
That’s a lot of code! And you likely never heard of some of the functions involved. With ggcharts you can create the same plot (actually an even better looking one) in a single line of code.
bar_chart(biomedicalrevenue, company, revenue, facet = year, top_n = 10)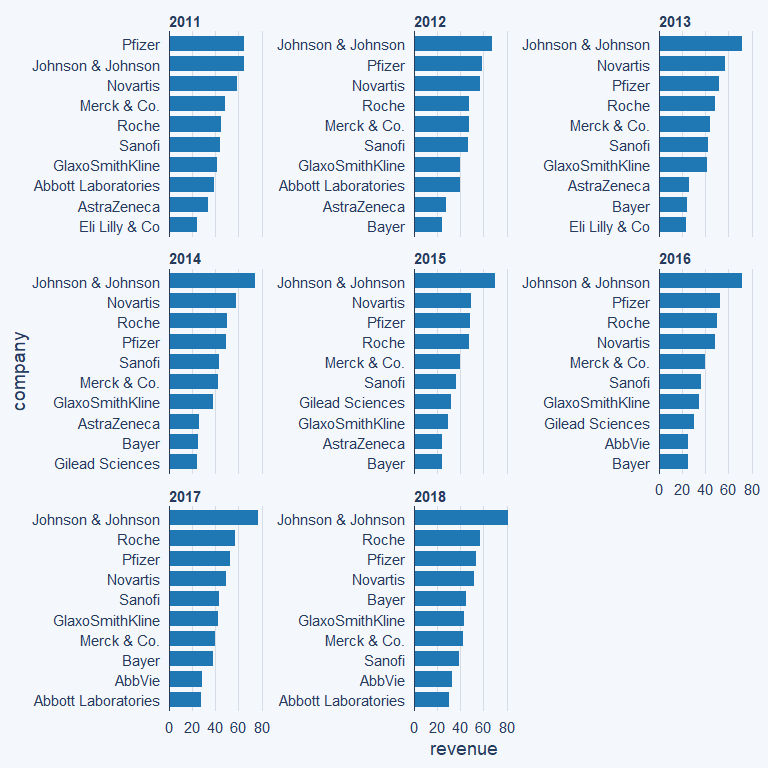
That’s the beauty of ggcharts: shortening the distance
between data visualization idea and actual plot as much as possible.
Currently ggcharts includes the following functions:
bar_chart()diverging_bar_chart()column_chart()lollipop_chart()diverging_lollipop_chart()dumbbell_chart()pyramid_chart()You can learn more about these functions here.