![]()
In data analysis, one may want to visualize data for a specific subgroup of observations. Simply filtering out observations that do not belong to the subgroup may take the information out of context. Therefore, it is necessary to have tools that allow the analyst to draw attention (focus) on that subgroup within the complete relevant information available.
While ggplot2 is a great tool for data visualization in
general, constructing graphics that focus on those subgroups may need
very troublesome manipulation of data and graphical scales (for example
colors) together, i.e. setting low alpha for unimportant observations,
coloring things in a way that highlights the focused subgroup, etc.
ggfocus allows you to build graphics that focus on those
specific subgroups by doing the scale manipulation automatically while
keeping all the flexibility from ggplot. The idea behind
this package is from this issue
from tidyverse/ggplot2.
The package is available on CRAN, but you can also install the latest
version from Github with pak.
pak::pak("Freguglia/ggfocus") # Latest version
install.packages("ggfocus") # CRAN versionThe workflow of ggfocus is the same as any
ggplot graphic with the addition of the focus
scales family of functions:
scale_color_focus(focus_levels, color_focus = NULL, color_other = "gray", palette_focus = "Set1")scale_fill_focus(focus_levels, color_focus = NULL, color_other = "gray", palette_focus = "Set1")scale_alpha_focus(focus_levels, alpha_focus = 1, alpha_other = .05)scale_linetype_focus(focus_levels, linetype_focus = 1, linetype_other = 3)scale_shape_focus(focus_levels, shape_focus = 8, shape_other = 1)scale_size_focus(focus_levels, size_focus = 3, size_other = 1)The user should map the variable with the grouping variable to all
the aes used to highlight observations and then use these
functions to automatically create scales that highlight a specified
group of observations.
Both the selected and unselected groups characteristics are customizable with the parameters of focus scales. See the examples below.
Creating an example dataset.
library(ggfocus)
set.seed(1)
# Create an example dataset
df <- data.frame(u1 = runif(300),
                 u2 = runif(300),
                 grp = sample(LETTERS[1:10], 300, replace = TRUE))
head(df)
#>          u1         u2 grp
#> 1 0.2655087 0.67371223   C
#> 2 0.3721239 0.09485786   E
#> 3 0.5728534 0.49259612   B
#> 4 0.9082078 0.46155184   E
#> 5 0.2016819 0.37521653   E
#> 6 0.8983897 0.99109922   C
Suppose that we are mainly interested in groups A and
B, but we do not want to lose the u1 and
u2 information from other groups. Visualizing with focus on
observations such that grp is A or
B is shown below.
# Default scales
ggplot(df, aes(x = u1, y = u2, color = grp)) +
  geom_point() +
  ggtitle("Standard Scales")
# Focus scales
ggplot(df, aes(x = u1, y = u2, color = grp, alpha = grp)) +
  geom_point() +
  scale_color_focus(c("A", "B"), color_focus = c("blue", "red")) +
  scale_alpha_focus(c("A", "B")) +
  ggtitle("Focus Scales")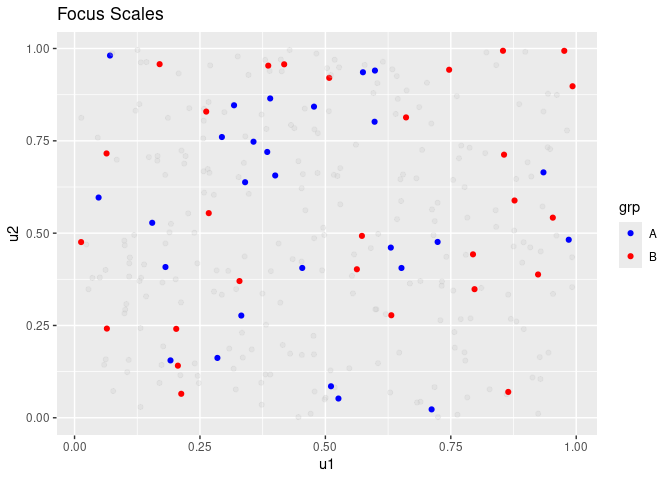
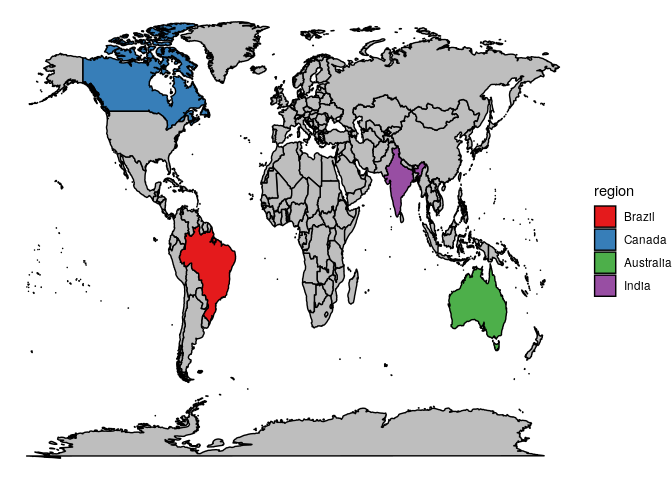
Since ggfocus creates the focused visualization solely
by controlling scales, other ggplot extensions and types of
graphics can interact with it the same way, an example with the
maps package is shown below.
library(maps)
wm <- map_data("world")
ggplot(wm, aes(x = long, y = lat, group = group, fill = region)) +
  geom_polygon(color = "black") +
  theme_void() +
  scale_fill_focus(c("Brazil", "Canada", "Australia", "India"),
                   color_other = "gray")