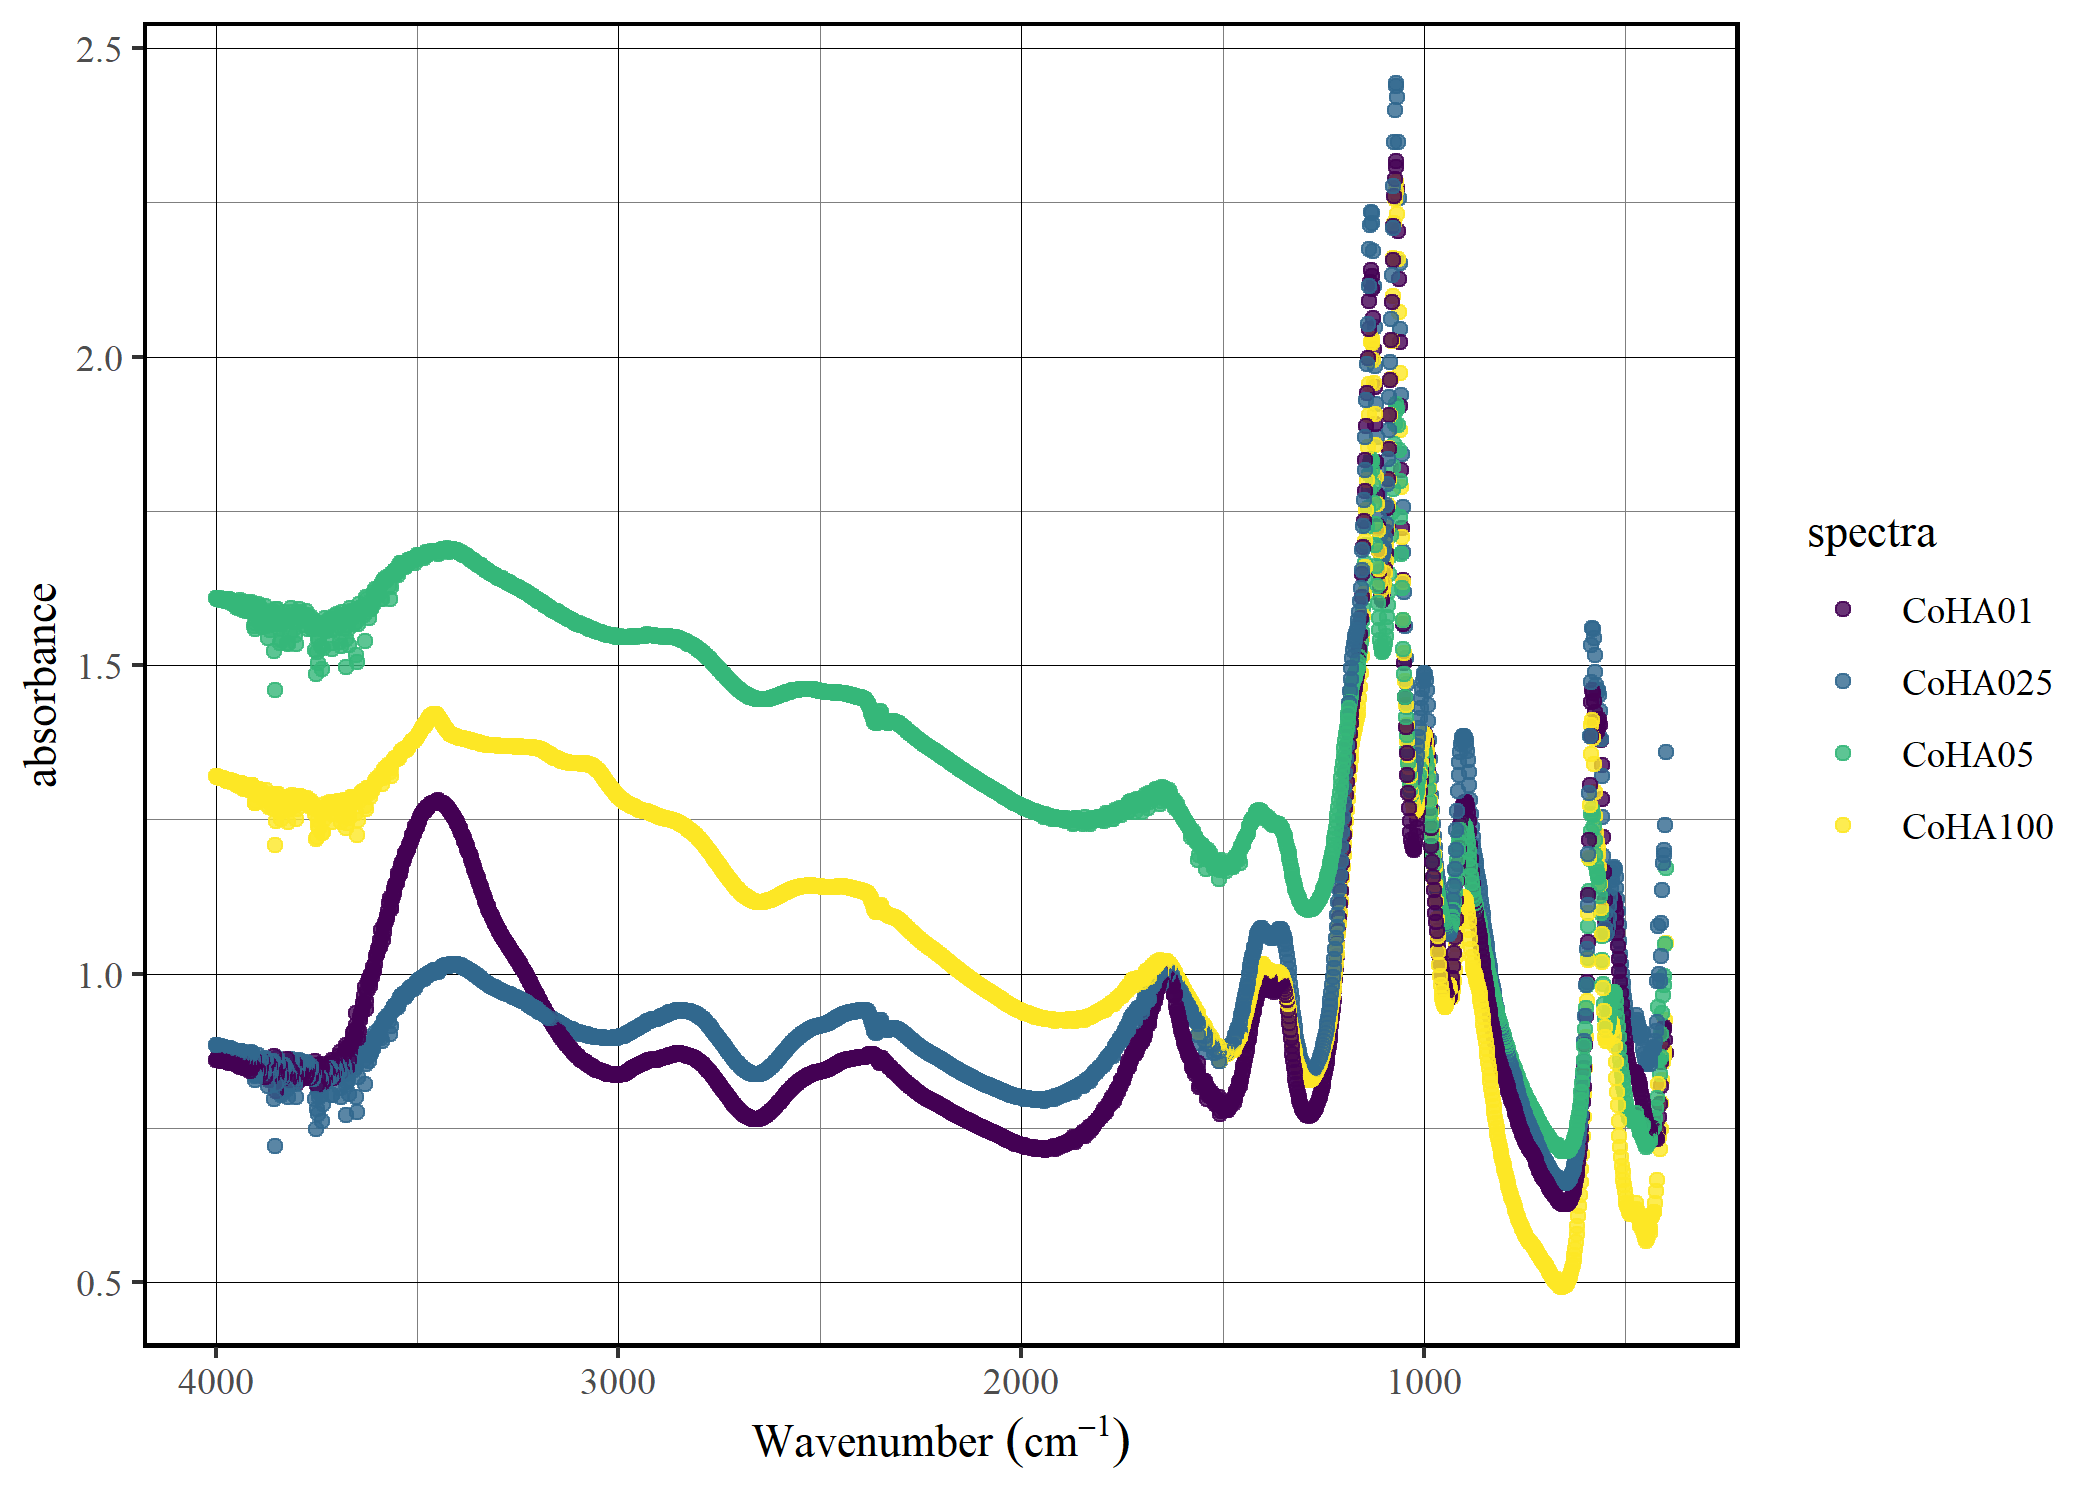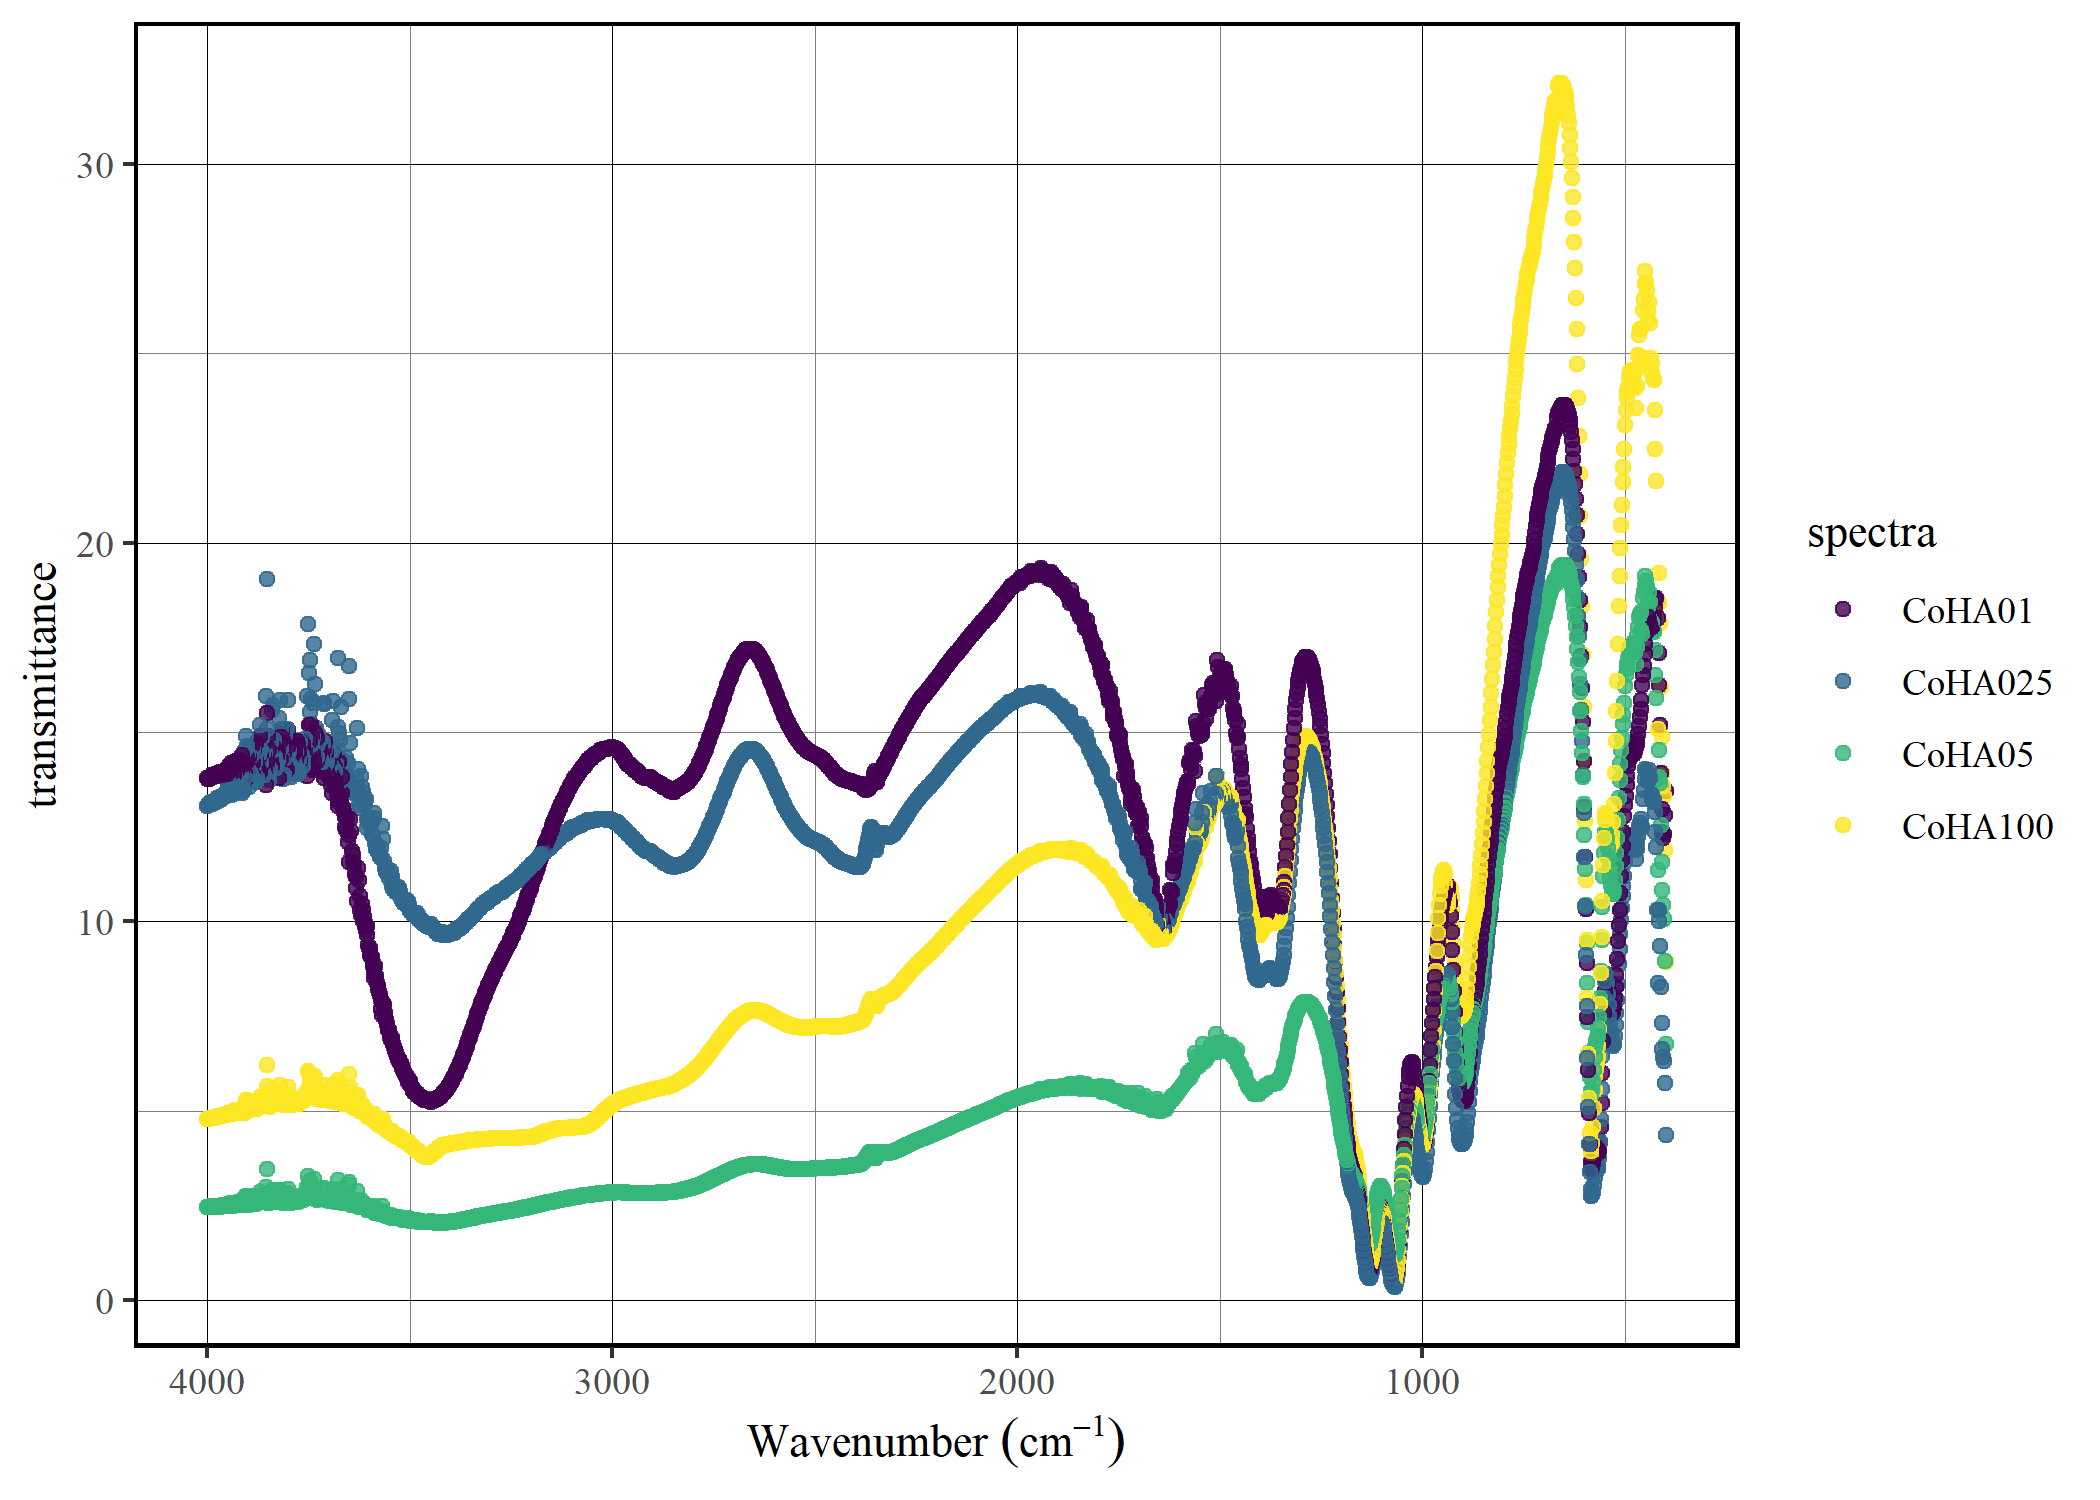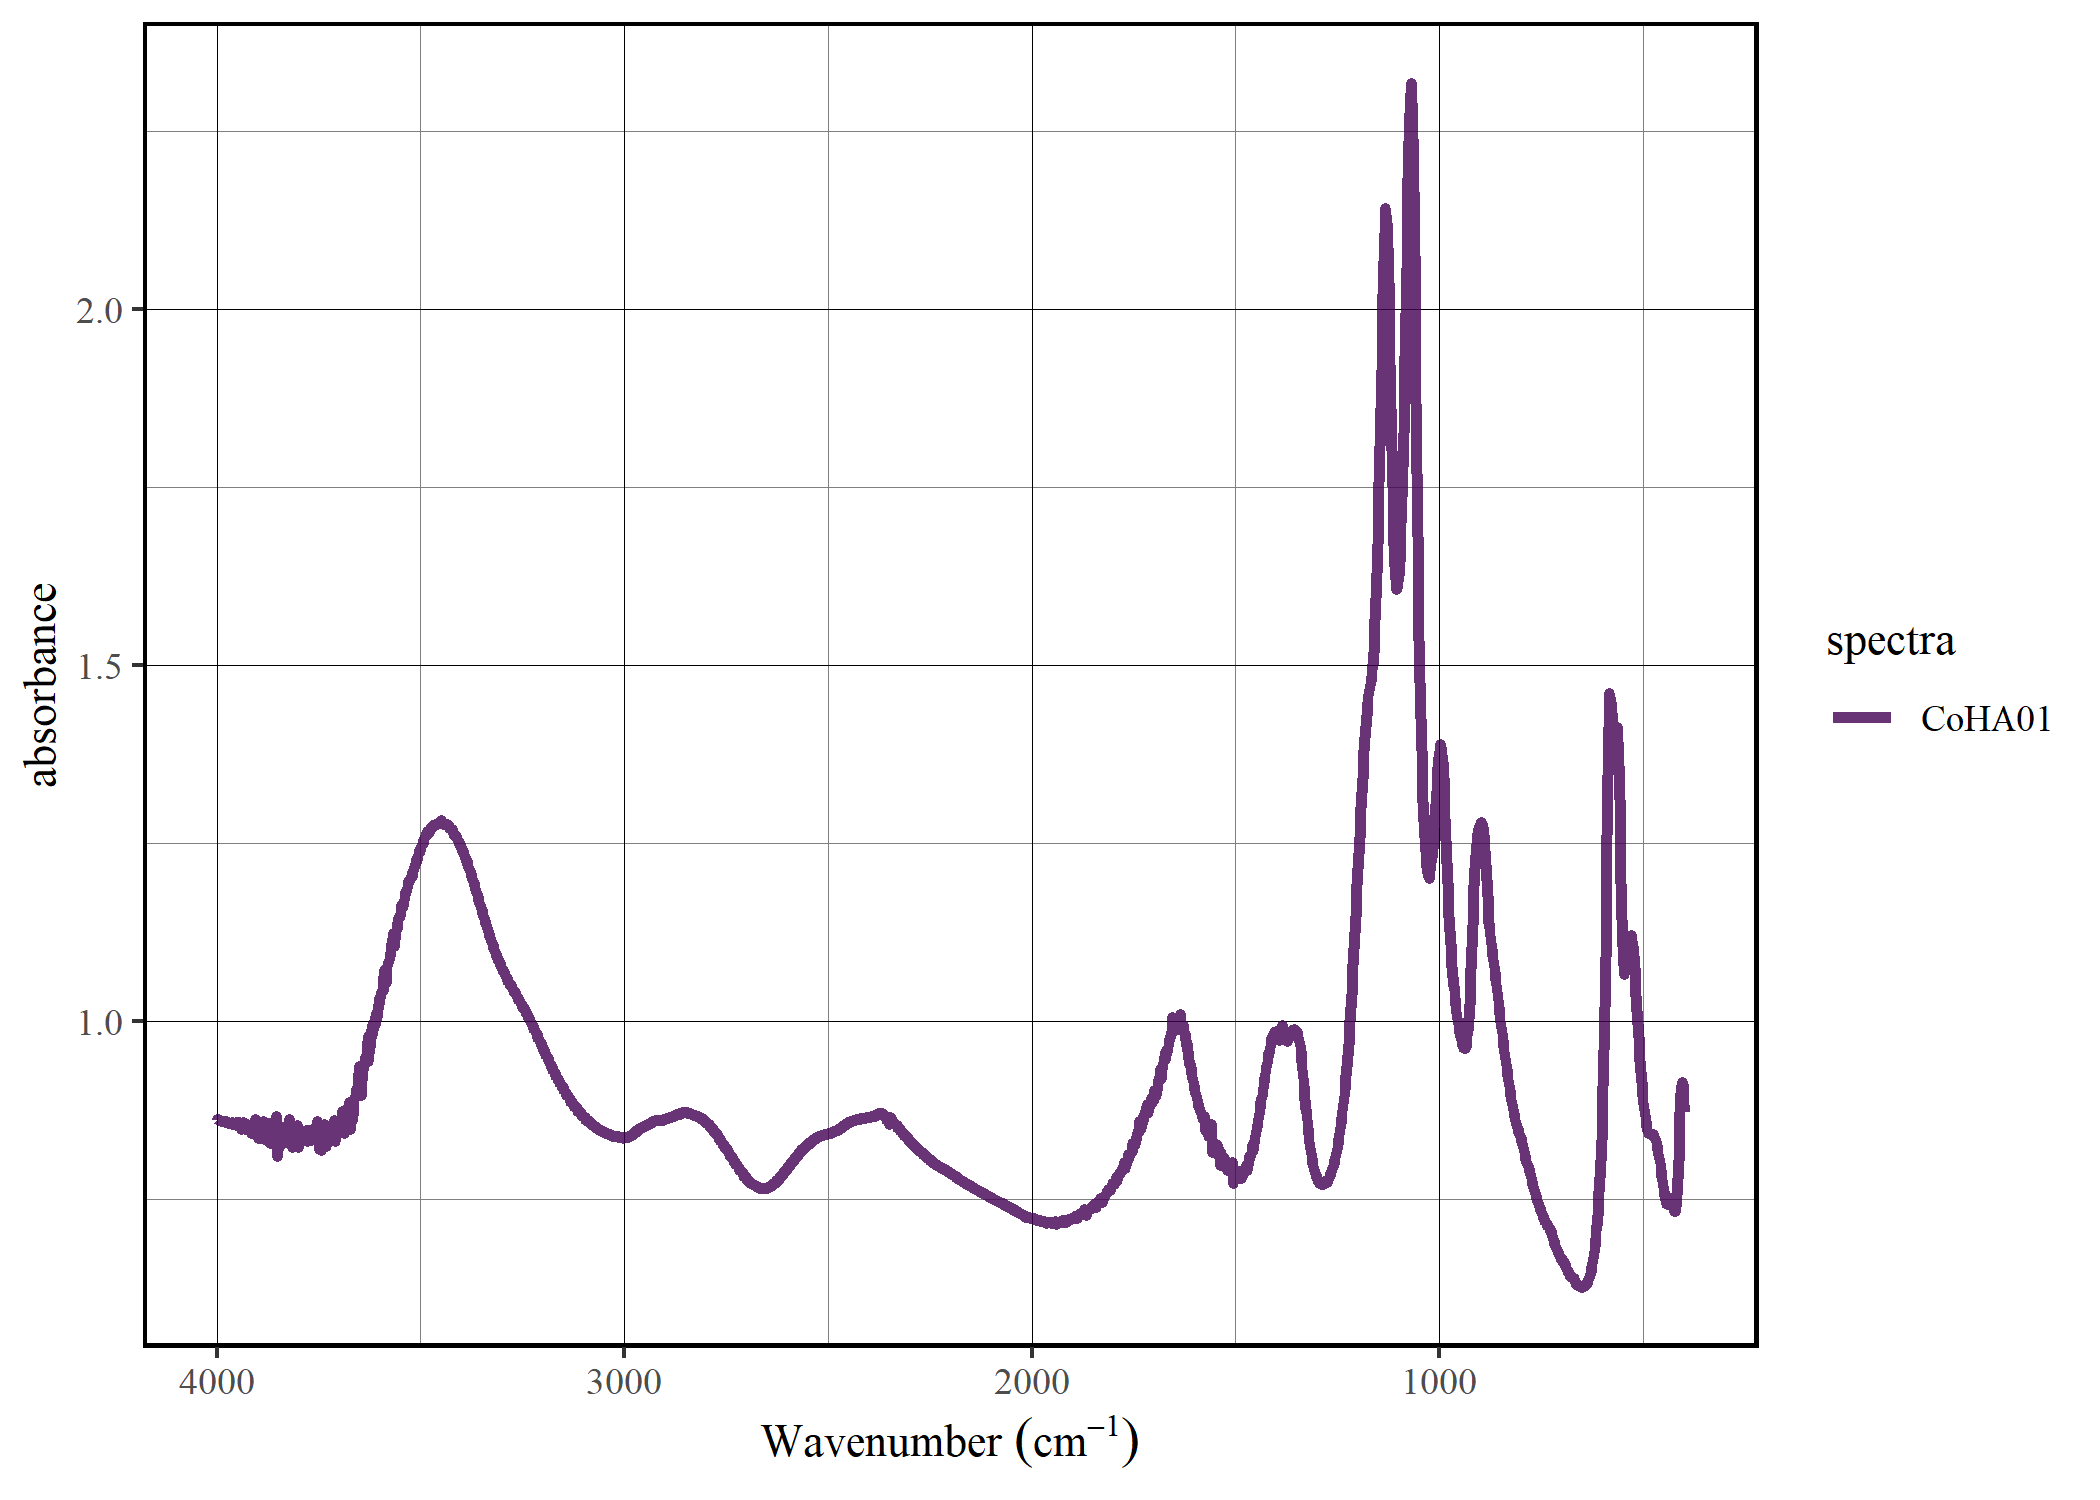

The goal of tidyspec is to provide a friendly pipeline for spectroscopy analysis using the tidy data philosophy.
You can install the development version of tidyspec from GitHub with:
# install.packages("devtools")
devtools::install_github("marceelrf/tidyspec")The tidyspec package was design to enable the data
analysis of spectroscopy data (as IR, Raman, NMR) with the tidy-data
format. There are 6 families of functions in tidyspec, all
starting with spec_:
Transformation: Convert data from absorbance to
transmittance (spec_abs2trans) & from transmittance to
absorbance (spec_trans2abs).
Normalize: Normalize the data to range 0-1
(spec_norm_01), normalize between a custom range
(spec_norm_minmax), or normalize to have a standard
deviation of one (spec_norm_var).
Baseline correction: Correct the baseline using
the the rolling ball algorithm
(spec_blc_rollingBall) or Iterative Restricted Least
Squares (spec_blc_irls). The function
spec_bl return the baseline vectors
(spec_bl_rollingBall, spec_bl_irls).
Smooth correction: Smooth the data using the
average window (spec_smooth_avg) or using the
Savitzky-Golay algorithm (spec_smooth_sga).
Derivative: Create differential data from the
spectra (spec_diff).
Preview: Preview your data while applying
changes statically (spec_smartplot) or interactively
(spec_smartplotly).
Import/Export: Import spectra data from common
data formats, like csv, txt, tsv, xslx and xls, with
spec_read. Export functions will be created in next moment,
but user can easily use {readr} or {writexl}
functions.
The function set_spec_wn simplifies the use of functions
by globally defining the column that contains the wave numbers. User can
check the wavenumber column with check_wn_col.
This is a basic example which shows you how to solve a common problem:
library(tidyspec)head(CoHAspec)
#> # A tibble: 6 x 5
#> Wavenumber CoHA01 CoHA025 CoHA05 CoHA100
#> <dbl> <dbl> <dbl> <dbl> <dbl>
#> 1 399. 0.871 1.36 1.17 1.05
#> 2 401. 0.893 1.24 1.05 0.925
#> 3 403. 0.910 1.20 0.997 0.876
#> 4 405. 0.914 1.19 0.982 0.867
#> 5 407. 0.908 1.18 0.965 0.857
#> 6 409. 0.887 1.14 0.936 0.828set_spec_wn("Wavenumber")
check_wn_col()
#> The current wavenumber column is: Wavenumberspec_smartplot(CoHAspec)
CoHAspec |>
    spec_abs2trans() |>
    spec_smartplot(type = "transmittance")
spec_select(CoHAspec, CoHA01) |>
  spec_smartplot(geom = "line")
tidyspecOur plan is for tidyspec to be the first step toward a complete ecosystem for spectral data analysis. For spectral band analysis, we are creating the bandspec package that handles different band profiles. We also intend to create a package focused on producing publication-level graphics for spectral data. We haven’t thought of a name yet, so we welcome suggestions!